From CSBLwiki
Biomodel database
Running SBML
R-project
Matlab
M = getstoichmatrix(modelObj)
[M,objSpecies] = getstoichmatrix(modelObj)
[M,objSpecies,objReactions] = getstoichmatrix(modelObj)
Readings
- Math tutorials
- Metabolic Control Analysis (MCA)
Term project
2009 Fall
- Reconstructing central carbon pathways in target organims
- Example using SBMLR
1. Curto, R., Voit, E. O. and Cascante, M. Analysis of abnormalities in purine metabolism leading to
gout and to neurological dysfunctions in man. Biochem.J. 329 (Pt 3), 477-487 (1998a).
2. Curto, R., Voit, E. O., Sorribas, A. and Cascante, M. Validation and steady-state analysis of a
power-law model of purine metabolism in man. Biochem.J. 324 (Pt 3), 761-775 (1997).
3. Curto, R., Voit, E. O., Sorribas, A. and Cascante, M. Mathematical models of purine metabolism
in man. Math.Biosci. 151, 1-49 (1998b)
## installing Bioconductor
source("http://bioconductor.org/biocLite.R")
biocLite() # install default packages
biocLite(c("KEGGgraph","SBMLR")) # install specified packages
## loading packages by 'library' function
library(KEGGgraph)
##
##---- The following example performs a perturbation in PRPP from 5 to 50 uM in Curto et al.
##
library(SBMLR)
library(odesolve)
curto=readSBML(file.path(system.file(package="SBMLR"), "models/curto.xml"))
summary(curto)
names(curto)
out1=simulate(curto,seq(-20,0,1))
curto$species$PRPP$ic=50
out2=simulate(curto,0:70)
outs=data.frame(rbind(out1,out2))
attach(outs)
par(mfrow=c(2,1))
plot(time,IMP,type="l")
plot(time,HX,type="l")
par(mfrow=c(1,1))
detach(outs)
# which should be the same plots as
curto=readSBMLR(file.path(system.file(package="SBMLR"), "models/curto.r"))
out1=simulate(curto,seq(-20,0,1))
curto$species$PRPP$ic=50
out2=simulate(curto,0:70)
outs=data.frame(rbind(out1,out2))
attach(outs)
par(mfrow=c(2,1))
plot(time,IMP,type="l")
plot(time,HX,type="l")
par(mfrow=c(1,1))
detach(outs)
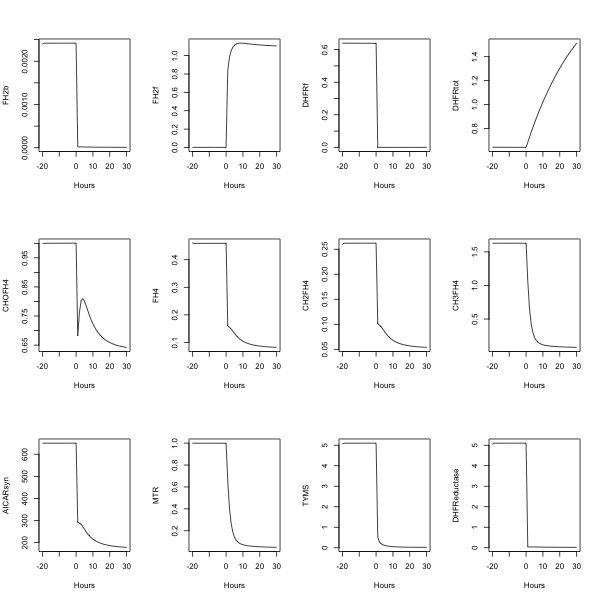
##---- The following example uses fderiv to generate Morrison's folate system response to
morr=readSBMLR(file.path(system.file(package="SBMLR"), "models/morrison.r"))
out1=simulate(morr,seq(-20,0,1))
morr$species$EMTX$ic=1
out2=simulate(morr,0:30)
outs=data.frame(rbind(out1,out2))
attach(outs)
pdf(file="output.pdf",paper="A4")
par(mfrow=c(3,4))
plot(time,FH2b,type="l",xlab="Hours")
plot(time,FH2f,type="l",xlab="Hours")
plot(time,DHFRf,type="l",xlab="Hours")
plot(time,DHFRtot,type="l",xlab="Hours")
plot(time,CHOFH4,type="l",xlab="Hours")
plot(time,FH4,type="l",xlab="Hours")
plot(time,CH2FH4,type="l",xlab="Hours")
plot(time,CH3FH4,type="l",xlab="Hours")
plot(time,AICARsyn,type="l",xlab="Hours")
plot(time,MTR,type="l",xlab="Hours")
plot(time,TYMS,type="l",xlab="Hours")
#plot(time,EMTX,type="l",xlab="Hours")
plot(time,DHFReductase,type="l",xlab="Hours")
dev.off()