From CSBLwiki
Biomodel database
Running SBML
R-project
Matlab
M = getstoichmatrix(modelObj)
[M,objSpecies] = getstoichmatrix(modelObj)
[M,objSpecies,objReactions] = getstoichmatrix(modelObj)
Readings
- Math tutorials
- Metabolic Control Analysis (MCA)
Term project
2009 Fall
- Reconstructing central carbon pathways in target organims
- Example using SBMLR
- Curto, R., Voit, E. O. and Cascante, M. Analysis of abnormalities in purine metabolism leading to gout and to neurological dysfunctions in man. Biochem.J. 329 (Pt 3), 477-487 (1998a).
- Curto, R., Voit, E. O., Sorribas, A. and Cascante, M. Validation and steady-state analysis of a power-law model of purine metabolism in man. Biochem.J. 324 (Pt 3), 761-775 (1997).
- Curto, R., Voit, E. O., Sorribas, A. and Cascante, M. Mathematical models of purine metabolism in man. Math.Biosci. 151, 1-49 (1998b)
## installing Bioconductor
source("http://bioconductor.org/biocLite.R")
biocLite() # install default packages
biocLite(c("KEGGgraph","SBMLR")) # install specified packages
## loading packages by 'library' function
library(KEGGgraph)
##
##---- The following example performs a perturbation in PRPP from 5 to 50 uM in Curto et al.
##
library(SBMLR)
library(odesolve)
curto=readSBML(file.path(system.file(package="SBMLR"), "models/curto.xml"))
summary(curto)
names(curto)
out1=simulate(curto,seq(-20,0,1))
curto$species$PRPP$ic=50
out2=simulate(curto,0:70)
outs=data.frame(rbind(out1,out2))
attach(outs)
par(mfrow=c(2,1))
plot(time,IMP,type="l")
plot(time,HX,type="l")
par(mfrow=c(1,1))
detach(outs)
# which should be the same plots as
curto=readSBMLR(file.path(system.file(package="SBMLR"), "models/curto.r"))
out1=simulate(curto,seq(-20,0,1))
curto$species$PRPP$ic=50
out2=simulate(curto,0:70)
outs=data.frame(rbind(out1,out2))
attach(outs)
par(mfrow=c(2,1))
plot(time,IMP,type="l")
plot(time,HX,type="l")
par(mfrow=c(1,1))
detach(outs)
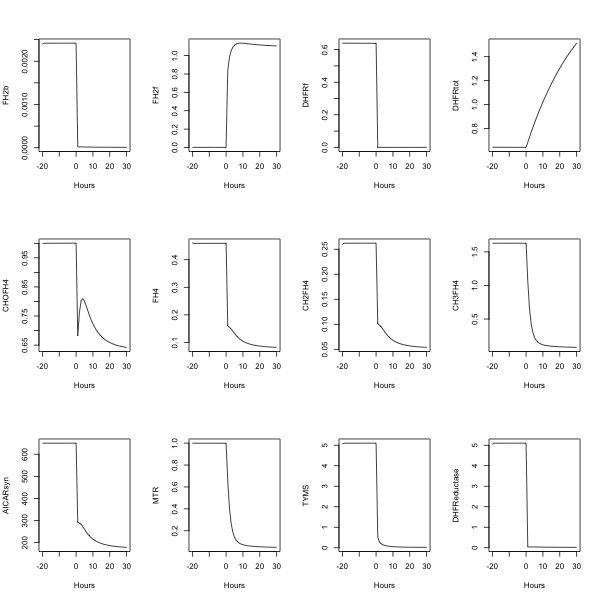
##---- The following example uses fderiv to generate Morrison's folate system response to
morr=readSBMLR(file.path(system.file(package="SBMLR"), "models/morrison.r"))
out1=simulate(morr,seq(-20,0,1))
morr$species$EMTX$ic=1
out2=simulate(morr,0:30)
outs=data.frame(rbind(out1,out2))
attach(outs)
pdf(file="output.pdf",paper="A4")
par(mfrow=c(3,4))
plot(time,FH2b,type="l",xlab="Hours")
plot(time,FH2f,type="l",xlab="Hours")
plot(time,DHFRf,type="l",xlab="Hours")
plot(time,DHFRtot,type="l",xlab="Hours")
plot(time,CHOFH4,type="l",xlab="Hours")
plot(time,FH4,type="l",xlab="Hours")
plot(time,CH2FH4,type="l",xlab="Hours")
plot(time,CH3FH4,type="l",xlab="Hours")
plot(time,AICARsyn,type="l",xlab="Hours")
plot(time,MTR,type="l",xlab="Hours")
plot(time,TYMS,type="l",xlab="Hours")
#plot(time,EMTX,type="l",xlab="Hours")
plot(time,DHFReductase,type="l",xlab="Hours")
dev.off()